
Abstract
Practitioners report that Horizon Europe grants have become harder to win, and commonly attribute this to the spread of AI-assisted proposal writing raising the quality of the applicant field. Published dashboards, however, show an almost flat average funding threshold. This paper tests four competing explanations - score inflation, rising submission volume, contracting grant supply, and measurement artifact - against call-level evaluation results for 1,332 RIA and IA topics. After a 31-check data quality audit, the analysis is run on two separate tracks, because a single database column mixes two incompatible scoring scales: single-stage calls (three criteria, maximum 15) and two-stage calls, whose stage-1 reports are scored on two criteria out of 10.
Three findings emerge. First, the flat dashboard trend is a measurement artifact: on the single-stage track the mean cutoff rose from 13.52 to 14.05 between 2024 and 2026 (+0.247 points per year, p = 0.0013 with cluster fixed effects), and the share of topics requiring a perfect 15.0 nearly doubled. Second, score inflation is not supported: the distribution of scores among qualified proposals is statistically unchanged across five independent tests, and the inadmissible share of submissions rose rather than fell. Third, the mechanism is crowding: submissions per topic increased 41% while grants awarded per topic remained flat and delivery ran to plan, raising qualified proposals per grant by 50%. Controlling for crowding removes the year effect on the cutoff entirely (p = 0.39), attributing approximately 80% of the rise to competition intensity. The results are consistent with applying having become cheaper rather than proposals having become better.
Keywords: Horizon Europe · research funding · evaluation thresholds · competition intensity · selection bias · observational analysis
1. Introduction
1.1 Background
Horizon Europe evaluates Research and Innovation Actions (RIA) and Innovation Actions (IA) against three criteria - Excellence, Impact, and Quality and Efficiency of the Implementation - each scored from 0 to 5, giving a maximum of 15 points. A proposal must reach an overall score of 10 to be considered of adequate quality; proposals at or above that bar are "above threshold". Because budgets are finite, the Commission funds down a ranked list until the money runs out. The score of the last funded proposal - the de facto funding cutoff - is therefore not a fixed administrative bar but an emergent property of how many good proposals competed for how much money.
That cutoff is what applicants actually face. A published threshold of 10 is irrelevant if, in practice, nothing below 14 has been funded in a given topic for two years. Tracking its movement over time is consequently of direct practical interest to research organisations planning where to spend proposal-writing effort.
1.2 Motivation
This analysis was prompted by an apparent contradiction. A funding-tracker dashboard computing the mean cutoff per call year showed an almost flat series - approximately 12.5, 13.3, 13.0, and 13.3 for 2023 through 2026 - implying that competitive conditions had barely changed. Practitioners, meanwhile, consistently reported that winning had become materially harder, and widely attributed this to the diffusion of large language models into proposal writing: if AI assistance lifts the quality of the average submission, the argument goes, evaluation outcomes should compress toward the top of the scale and the cutoff should rise.
Both observations cannot be straightforwardly true. Either the perceived difficulty is not reflected in outcomes, or the measurement is wrong, or the difficulty has a different cause. This paper adjudicates between those possibilities.
1.3 Competing explanations
Four mechanisms could raise a de facto cutoff, and they make different, separable predictions about the observable aggregates:
-
Score inflation. Proposals score better than before. Predicts a rising share of proposals in the top score bands, in absolute terms as well as relative to those above threshold.
-
Demand growth. More proposals compete for each topic. Predicts rising submissions per topic, with the score distribution unchanged.
-
Supply contraction. Fewer grants or less money per topic. Predicts falling grants awarded, or delivery short of plan.
-
Measurement artifact. The trend is an aggregation error. Predicts that the trend changes when the population is defined correctly.
Because these predictions diverge, aggregate data can discriminate between them even though it contains no direct observation of AI use.
1.4 Research questions
Table 1. Research questions and summary verdicts. Section references point to where each is answered.
| # | Question | Verdict | § |
|---|---|---|---|
| RQ1 | Is the de facto funding cutoff rising? | Yes | 5.2 |
| RQ2 | Are evaluation scores inflating upward? | No | 5.3 |
| RQ3 | Are more proposals submitted per topic? | Yes | 5.4 |
| RQ4 | Is grant supply contracting? | No | 5.4 |
| RQ5 | Which mechanism connects these to the cutoff? | Crowding | 5.5 |
| RQ6 | Do two-stage calls behave the same way? | No - separate regime | 5.6 |
1.5 Contributions
The paper makes three contributions. It identifies and quantifies a scale-mixing error that inverts the published trend for the most recent year. It provides a direct test of the score-inflation hypothesis on aggregate score-band data, returning a consistent null. And it offers an exact additive decomposition of competition intensity into its demand, quality, and supply components, together with a counterfactual estimate of how much of the cutoff movement competition explains.
2. Data
2.1 Source and unit of observation
The data are call-level evaluation results ("flash results") published by the European
Commission on the Funding & Tenders portal, scraped into a local PostgreSQL database.
The snapshot analysed was taken on 11 August 2026 and contains 1,040 evaluation records
across all programme types. The unit of observation is the topic - a single
funding call identified by a topic ID such as
HORIZON-CL5-2024-D3-01-02. Call year is taken from the four-digit token in
that identifier.
The analysis population is restricted to Horizon Europe RIA and IA topics, including Joint Undertaking variants: 1,332 topics spanning call years 2023 to 2027 across 13 programme parts, of which 557 carry a published evaluation record.
2.2 Variables
For each topic the portal publishes aggregate counts only. The fields used here are: proposals submitted; proposals above threshold; proposals retained for funding; reserve-list count; inadmissible and ineligible counts; the funding threshold (the cutoff score); three coarse score bands counting proposals scoring 14–15, 13–14 and 10–13; total budget requested by above-threshold proposals; and the planned number of grants with minimum and maximum funding per grant. Topic metadata supplies programme part (cluster), type of action, deadline model, and the deadline schedule.
2.3 Coverage
Table 2. Analysis population and coverage. Only single-stage topics in 2024–2026 enter the main analysis; the reasons are given in §4.3.
| Population | Topics | With cutoff | Proposals | Grants |
|---|---|---|---|---|
| All RIA/IA topics, 2023–2027 | 1,332 | 423 | - | - |
| … with an evaluation record | 557 | 423 | - | - |
| Two-stage track (all years) | 156 | 51 | - | - |
| Single-stage track, 2024–2026 (main analysis) | 960 | 367 | 21,809 | 1,056 |
Of the 367 cutoffs, 216 are RIA and 151 IA. Complete score-band records - all three bands present, covering 5,748 individually scored proposals - exist for 363 topics. Complete funnels (submissions, qualified and grants all observed and coherent) exist for 391 topics.
2.4 What the data cannot observe
The data are strictly aggregate. There are no proposal texts, no per-proposal scores, no criterion-level breakdowns, no applicant or consortium identities, and no record of writing tools used. Consequently no test in this paper measures AI use directly. The score-inflation hypothesis is instead tested through the trace it would necessarily leave in the aggregates - a shift in the score distribution - which is observable.
Two further absences matter. Evaluation results appear only after a call closes and its panel reports, so recent years are systematically incomplete (§5.1). And for two-stage calls the submissions field does not distinguish stage-1 from stage-2 applicant pools, which constrains what can be computed for that track (§5.6).
3. Assumptions
The analysis rests on eight assumptions. Each is stated with its validation status: validated means tested against the data in this paper, partial means tested indirectly or with residual uncertainty, and untested means accepted without verification. Sections affected by each are noted.
-
Call year equals the year token in the topic identifier untested No independent field records the competition cycle. The convention is uniform across the dataset, so any mismatch adds noise rather than trend. Affects all sections.
-
Single-stage RIA/IA cutoffs are one comparable scale validated Three criteria, maximum 15, quality bar 10, stable across years and clusters. After cleaning, all 367 values fall within [10, 15] with no exceptions. Affects §5.2–5.5.
-
Two-stage records comprise two distinct report types validated Stage-1 reports (cutoff ≤ 10, no 15-scale score bands) and stage-2 reports (cutoff > 10). The separation is perfect on both signals with zero ambiguous rows (§5.1). Affects §4.3, §5.6.
-
Results attached to topics with a future final deadline are stage-1 publications, not errors validated All 17 such records are two-stage topics whose first deadline has passed. Any single-stage record with this pattern would be treated as impossible and dropped; after data corrections there are none. Affects §5.1, §5.6.
-
Submissions counts measure topic-level applications partial Stress-tested under six variants; the volume result survives all and strengthens when suspect rows are excluded (§5.4). For two-stage rows the field is ambiguous between applicant pools and is therefore used descriptively only. Affects §5.4–5.6.
-
Missing evaluation results are ignorable conditional on cluster and deadline timing partial Missingness is demonstrably non-random by cluster (χ² = 252.8, p = 7×10⁻⁴⁸) and by deadline timing (p = 2×10⁻²¹), motivating cluster fixed effects throughout. It is not related to call size (p = 0.276), which protects the volume estimates. Residual dependence on unobserved topic characteristics cannot be excluded. Affects all trend estimates.
-
2026 is a partial, early-deadline sample rather than a closed year validated 63 of 314 single-stage topics have resolved; only two clusters are usable. All headline results are re-estimated on a like-for-like panel. 2023 (n = 5) and 2027 (no results) are excluded. Affects all year comparisons.
-
Statistical conventions stipulated Two-sided tests at α = 0.05; Benjamini–Hochberg correction within each per-cluster family; distribution-free trend tests reported alongside parametric models; counts modelled as negative binomial and proportions as binomial. Point estimates are reported irrespective of significance.
4. Methodology
4.1 Data quality audit
Because the data are scraped rather than supplied as an official statistical product, analysis was preceded by a scripted audit of 31 checks in six families: structural integrity (duplicate keys, orphaned records, missing classification); domain validity (negative counts, cutoffs outside the admissible range for their scale); accounting identities (score bands reconciling to above-threshold counts; retained ≤ above threshold ≤ submitted; reserve list and admissibility bounds); temporal consistency (results predating deadlines, opening dates after deadlines); missingness structure (dependence on cluster, deadline timing and call size); and distributional anomalies (robust z-scores, rounding artifacts, zero-grant topics).
Each check was assigned a severity: blocking (must be resolved or excluded before analysis), warning (analyse but caveat), or informational. Blocking findings were investigated individually rather than dropped mechanically, because the cause determines whether exclusion or reclassification is correct.
4.2 Cleaning rules
Six rules follow from the audit. R1: the primary analysis set is single-stage topics only. R2: two-stage records are split by report type rather than merged or discarded; stage-1 records are excluded from cutoff analysis as a different scale, and stage-2 records are used as a sensitivity check on the single-stage result but never for volume or success metrics. R3: single-stage records whose results predate their final deadline are impossible and are dropped. R4: ratio metrics are computed only on internally consistent funnels. R5: call years 2024–2026 only. R6: score-band analysis uses shares within the reported bands rather than counts benchmarked against the above-threshold total, because the two reconcile imperfectly (§5.1) - a discrepancy that does not trend over time (τ = +0.079, p = 0.088) and therefore cannot bias a trend in shares.
4.3 The two-track design
The single most consequential methodological decision is to analyse single-stage and two-stage calls separately. A two-stage topic produces up to two evaluation reports. The stage-1 report scores two criteria out of 10 and determines who is invited to submit a full proposal; the stage-2 report scores three criteria out of 15 and determines funding. Both are stored in the same database column with no type indicator.
Averaging them is not a minor imprecision. It compares a 10-point scale with a 15-point scale, and because the mix of report types available in any given year depends on where calls sit in their deadline cycle, the mixture itself moves over time. §5.6 quantifies the resulting distortion, which reaches −0.90 points in 2026 and reverses the direction of the published trend.
4.4 Statistical methods
Trends in continuous outcomes are tested with Kendall's τ-b, which assumes no distributional form, and Kruskal–Wallis tests for any between-year difference. Magnitudes are estimated by ordinary least squares on call year, first unadjusted and then with cluster fixed effects to absorb composition changes, and with standard errors clustered by programme part. Count outcomes (submissions, grants) use negative binomial generalised linear models with cluster and action fixed effects, reported as incidence rate ratios. Proportion outcomes (pass rate, funding rate, band shares) use binomial GLMs weighted by the underlying proposal counts, reported as odds ratios, alongside Cochran–Armitage tests for trend on the pooled aggregates. Per-cluster families of tests carry Benjamini–Hochberg false-discovery-rate correction.
Competition intensity is decomposed exactly. Since qualified proposals per grant equals submissions multiplied by pass rate divided by grants, the change in its logarithm is the sum of the corresponding log changes, allowing each component's contribution to be attributed without residual.
4.5 Robustness strategy
Three threats are addressed systematically. Composition change is handled with cluster fixed effects and by re-estimating every headline result on a like-for-like panel restricted to the only two clusters with usable data in all three years. Measurement error in the submissions variable is handled by re-estimating the volume trend under six alternative exclusion rules. Sample selection in 2026 is handled by testing whether resolved topics differ from unresolved ones in cluster, deadline timing and size, and by reporting where they do.
5. Results
5.1 Data quality
Twenty-one of 31 checks passed without exception, including all structural integrity checks, all domain checks on single-stage cutoffs, and the ordering constraints between retained, above-threshold and submitted counts. Two checks returned blocking findings and five returned warnings.
Table 3. Audit findings requiring action. Twenty-one further checks passed clean and are omitted.
| Finding | Cases | Of | Severity | Resolution |
|---|---|---|---|---|
| Results predate final deadline | 17 | 557 | Blocking | All two-stage; reclassified as stage-1 reports |
| Above threshold exceeds submitted | 15 | 476 | Blocking | Excluded from ratio metrics (R4) |
| Two-stage cutoff above 10 | 36 | 51 | Warning | Identified as stage-2 reports |
| Score bands do not reconcile | 72 | 391 | Warning | Shares used instead of counts (R6) |
| Missingness depends on cluster | - | - | Warning | χ² = 252.8, p = 7×10⁻⁴⁸; cluster FE throughout |
| Resolved topics skew early-deadline | - | - | Warning | p = 2×10⁻²¹; like-for-like panel |
| Reserve list exceeds above threshold | 1 | 453 | Warning | Single record; immaterial |
The first blocking finding proved to be a classification problem rather than corrupt data. All 17 records belong to two-stage topics whose first deadline had passed but whose second had not - exactly the circumstance in which a stage-1 report exists and a stage-2 report does not. Cross-tabulating cutoff level against the presence of 15-scale score bands separates the two report types perfectly: all 15 records at or below 10 lack score bands, and none of the 36 records above 10 falls below the 10-point quality bar. There are no ambiguous cases. This validates assumption A3 and motivates the two-track design.
The second blocking finding concerns 15 records in which more proposals are recorded above threshold than were submitted. Twelve are single-stage topics reporting implausibly few submissions (one, two or three) against much larger above-threshold counts, concentrated in 2024; three are two-stage topics where the two counts refer to different applicant pools. Since the submissions variable carries the central volume result, §5.4 reports a dedicated sensitivity analysis rather than relying on exclusion alone.
Score-band counts reconcile exactly with above-threshold totals in 81.6% of records and to within one proposal in 88.7%. The discrepancy shows no trend across years (τ = +0.079, p = 0.088), so band shares remain unbiased for trend testing even though band counts are imperfect.
5.2 RQ1 - The funding cutoff
On the single-stage track the mean cutoff rose from 13.52 in 2024 to 14.05 in 2026, with the median moving from 13.50 to 14.50. The trend is significant under every specification tested. Fitting the pooled series gives +0.257 points per year; adding cluster fixed effects, which absorb the substantial year-to-year change in which programme parts have resolved, barely moves the estimate to +0.247 (95% CI +0.097 to +0.397, p = 0.0013), indicating that composition is not driving the result.
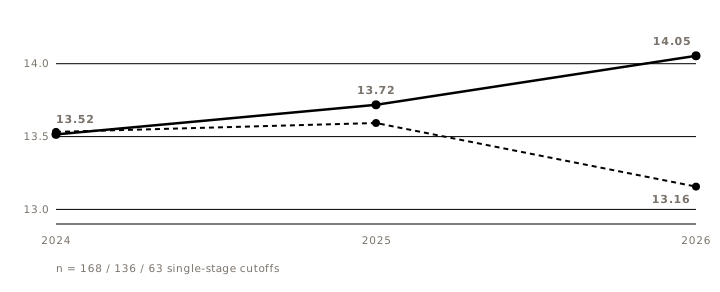
Table 4. Cutoff trend under alternative specifications. All estimates are points per call year.
| Specification | Estimate | 95% CI | p | n |
|---|---|---|---|---|
| OLS, unadjusted | +0.257 | +0.106, +0.407 | 0.0009 | 367 |
| OLS + cluster fixed effects | +0.247 | +0.097, +0.397 | 0.0013 | 367 |
| OLS + cluster + action FE | +0.247 | +0.097, +0.397 | 0.0013 | 367 |
| Cluster-robust standard errors | +0.247 | - | 0.0189 | 367 |
| Like-for-like panel (Clusters 5, 6) | +0.223 | - | 0.0139 | 197 |
| Including two-stage stage-2 records | +0.223 | - | 0.0031 | 401 |
| Kendall τ-b (distribution-free) | τ = +0.135 | - | 0.0019 | 367 |
Disaggregating by action type, the RIA series trends significantly (τ = +0.164, p = 0.0039) while the IA series does not (τ = +0.089, p = 0.190). A formal year-by-action interaction test, however, is null (p = 0.431), so the difference between the two slopes is not itself established; the correct statement is that the trend is demonstrable in RIA and not demonstrable in IA, not that the two differ. Per cluster, only Cluster 4 survives false-discovery correction (pBH = 0.0005), and its 2026 cell contains three topics; full per-cluster results appear in Appendix Table A1.
5.3 RQ2 - Score inflation
This is the decisive test of the practitioner hypothesis. If AI assistance were raising proposal quality, the distribution of scores would shift toward the upper bands. It does not. Among 5,748 proposals scored across the three years, the share in the top 14–15 band is 20.49%, 19.45% and 19.96% - a series with no trend whatever.
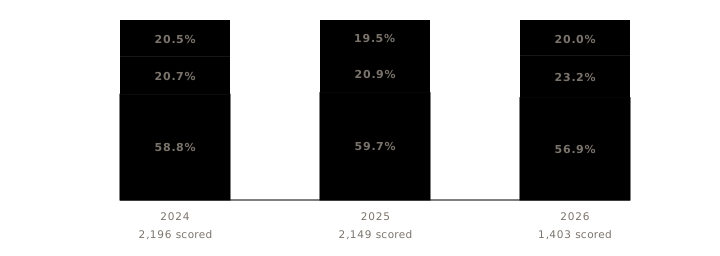
Table 5. Tests of upward score shift. All five return null results.
| Test | 2024 | 2025 | 2026 | Statistic | p |
|---|---|---|---|---|---|
| Share of qualified at 14–15 | 20.49% | 19.45% | 19.96% | z = −0.49 | 0.623 |
| Share of qualified at 13–15 | 41.21% | 40.34% | 43.12% | z = +0.96 | 0.337 |
| Year × band independence | - | - | - | χ² = 4.49 | 0.343 |
| Top-band share, GLM + cluster FE | - | - | - | OR = 0.945 | 0.194 |
| Top scorers per proposal submitted | 12.40% | 12.96% | 12.38% | z = +0.09 | 0.926 |
The final row is the strongest form of the test. Expressing top scorers as a share of all proposals submitted, rather than of those above threshold, removes any dependence on how many proposals cleared the bar: out of every hundred submissions, the number reaching 14–15 is unchanged. No cluster shows a significant trend after false-discovery correction (Appendix Table A3).
One related quantity did move. The pass rate - the share of submissions clearing the 10-point bar - rose from 54.2% to 61.7% (OR = 1.174 per year, p < 0.0001). Taken alone this is consistent with better-prepared proposals. Two features of the data argue against reading it as evidence of AI-driven quality improvement. First, the series is not monotonic: it peaks at 65.2% in 2025 and falls significantly in 2026 (z = −2.78, p = 0.005), in the pooled data and in the like-for-like panel alike, whereas the diffusion of a technology is a one-directional process. Second, and more directly, the share of submissions rejected as inadmissible or ineligible rose from 3.48% to 6.36% (z = +4.60, p < 0.0001), which is the opposite of what a general improvement in proposal preparation would produce.
5.4 RQ3 and RQ4 - Demand and supply
Submissions per topic rose 41.1%, from 24.66 to 34.80 on complete-funnel topics; the median rose from 13 to 21. A negative binomial model with cluster and action fixed effects estimates +21.4% per year (IRR = 1.213, 95% CI 1.097–1.343, p = 0.0002). Grants awarded per topic moved from 2.35 to 2.51, statistically indistinguishable from flat (IRR = 1.074, 95% CI 0.908–1.269, p = 0.406). The number of topics offered was stable across the period (360, 384 and 342), so this reflects more applicants rather than the same applicants concentrated into fewer calls.
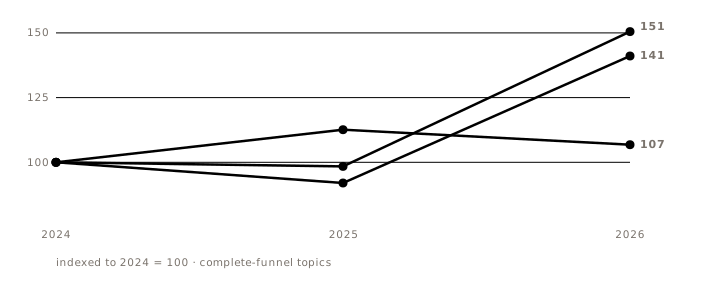
Because 12 topics record implausibly low submission counts (§5.1), the volume result was re-estimated under six exclusion rules and across nine sample cuts. It is positive and significant in every variant, and strengthens when suspect records are removed (τ rising from 0.093 to 0.169), confirming that the finding is not an artifact of those records. The single cut in which it does not hold is IA topics alone (τ = +0.026, p = 0.586). Full results appear in Appendix Table A4.
On the supply side, three further tests find no contraction. The ratio of grants awarded to grants planned is approximately 1.0 throughout (1.04, 1.07, 0.98; τ = −0.014, p = 0.752), and the proportion of topics delivering fewer grants than planned is unchanged at 8%. Median maximum funding per grant rose slightly from €5.0M to €6.0M (p = 0.064). The Commission is therefore awarding what it budgets; the squeeze originates entirely on the demand side.
5.5 RQ5 - Mechanism
Combining the preceding results, the number of qualified proposals competing for each grant rose 50.5%, from 5.69 to 8.56. Decomposing that change exactly into its three multiplicative sources attributes 84.3% to increased submissions, 31.8% to the higher pass rate, and −16.0% to the modest increase in grants awarded, which partially offsets the other two. On the like-for-like panel the split is 69.6%, 32.7% and −2.3%.
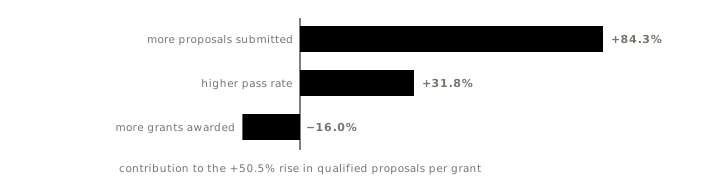
Table 6. The selection funnel, complete-case topics. The final two rows are the product of the two preceding ratios.
| Quantity | 2024 | 2025 | 2026 | Change |
|---|---|---|---|---|
| Proposals submitted per topic | 24.66 | 22.70 | 34.80 | +41.1% |
| Grants awarded per topic | 2.35 | 2.64 | 2.51 | +6.8% n.s. |
| Pass rate (score ≥ 10) | 54.2% | 65.2% | 61.7% | +13.9% |
| Qualified proposals per grant | 5.69 | 5.60 | 8.56 | +50.5% |
| Funding rate among qualified | 17.6% | 17.9% | 11.7% | −33.5% |
| Overall success rate | 9.5% | 11.7% | 7.2% | −24.3% |
Competition intensity and the cutoff are strongly associated at topic level (Spearman ρ = +0.654, n = 365, p = 7×10⁻⁴⁶). Introducing the logarithm of qualified proposals per grant into the cutoff model removes the year effect entirely: the year coefficient falls from +0.247 (p = 0.0014) to +0.050 (p = 0.388), while the competition coefficient is +0.894 (p < 0.0001). Holding competition at its 2024 level, the predicted 2026 cutoff would be 13.62 rather than the observed 14.05, attributing approximately 80% of the rise to competition intensity.
Two corroborating series point the same way. Budget oversubscription - the funding requested by above-threshold proposals - rose from a median of €49.2M to €79.2M per topic (τ = +0.121, p = 0.002). And the funding rate among qualified proposals fell by a third (OR = 0.823 per year, p = 0.0001), which is precisely what a fixed budget facing more qualified competitors produces.
Overall success fell 24.3% in level terms, from 9.5% to 7.2%, and the topic-level trend is significant (τ = −0.095, p = 0.017). The cluster-adjusted year coefficient, however, sits marginally outside conventional significance (OR = 0.918, p = 0.075). This is a mechanical consequence of success being the product of two components moving in opposite directions: 1.174 × 0.823 ≈ 0.97, close to unity. The direction is well supported; the year-on-year decline is not established at α = 0.05 once composition is controlled.
5.6 RQ6 - The two-stage regime
Two-stage calls behave differently enough that pooling them with single-stage calls would be misleading even if the scales were reconciled. Of 156 two-stage topics, 15 have published a stage-1 report, 36 a stage-2 report, and 105 no results yet.
Table 7. Two-stage composition and the distortion introduced by pooling report types with single-stage cutoffs.
| Year | Topics | Stage-1 | Stage-2 | Pending | Share of RIA/IA | Distortion |
|---|---|---|---|---|---|---|
| 2023 | 8 | 0 | 2 | 6 | 23.5% | - |
| 2024 | 50 | 1 | 18 | 31 | 13.9% | +0.02 |
| 2025 | 48 | 1 | 16 | 31 | 12.5% | −0.13 |
| 2026 | 28 | 13 | 0 | 15 | 8.2% | −0.90 |
| 2027 | 22 | 0 | 0 | 22 | 10.4% | - |
Distortion is the difference between the pooled mean cutoff and the single-stage mean for that year.
The 2026 distortion of −0.90 points explains the inversion in Figure 1 completely. It arises not from bad data but from calendar position: by August 2026 the first deadlines of that year's two-stage calls had passed, producing 13 stage-1 reports on the 10-point scale, while none of the second deadlines had, producing no stage-2 reports on the 15-point scale. Pooling therefore mixed a large block of low-scale values into the 2026 average and none into 2024 or 2025.
Substantively, two-stage adoption is declining: the two-stage share of RIA/IA topics fell from 13.9% in 2024 to 8.2% in 2026 (z = −2.03, p = 0.043). The stage-1 gate in 2026 sits at a mean of 8.81 out of 10, with an invitation rate to stage 2 of approximately 50% (median 0.50, n = 10). No trend is testable on 15 observations; the observed τ = −0.21 (p = 0.384) is uninformative at that sample size.
Stage-2 cutoffs moved in the opposite direction to single-stage ones, from 13.89 in 2024 (n = 18) to 12.84 in 2025 (n = 16). With only two time points this should be read as a difference between years rather than an established trend. Pooled across years, stage-2 cutoffs are marginally below single-stage cutoffs (13.40 versus 13.68, Mann–Whitney p = 0.062). Most strikingly, the funding rate among stage-2 proposals above threshold is approximately 45%, against 12–18% in single-stage calls: the stage-1 gate has already removed most competitors before the final ranking. End-to-end success cannot be computed, because the share of invited proposals that clear the stage-2 bar is not observable in this data.
5.7 Additional signals
Two further results sharpen the practical picture, and three informative nulls constrain alternative explanations.
First, the mean understates what applicants experience. The share of topics whose cutoff sits at the very top of the scale is rising considerably faster than the mean itself: the proportion funding only proposals scoring a perfect 15.0 nearly doubled from 12.5% to 23.8% (z = +2.17, p = 0.030), and the proportion cutting at 14.5 or above rose from 32.1% to 50.8% (z = +2.62, p = 0.009). By 2026, half of resolved topics required 14.5 out of 15.
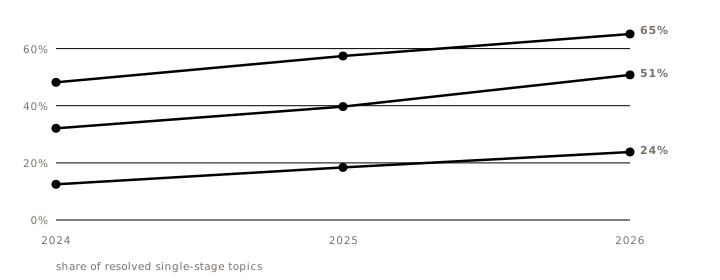
Table 8. Additional signals, including informative null results.
| Signal | 2024 | 2025 | 2026 | p | Interpretation |
|---|---|---|---|---|---|
| Inadmissible + ineligible share | 3.48% | 5.67% | 6.36% | <0.0001 | Rose - contradicts general improvement in preparation |
| Topics with success rate below 5% | 11.2% | 5.2% | 24.6% | 0.055 | Marginal; consistent with crowding |
| Grants awarded ÷ grants planned | 1.04 | 1.07 | 0.98 | 0.752 | Null - no covert supply reduction |
| Median maximum funding per grant | €5.0M | €6.0M | €6.0M | 0.064 | Slightly larger grants, not fewer |
| Reserve-listed proposals per grant | 0.80 | 0.70 | 0.89 | 0.490 | Null - reserve lists are administratively capped |
6. Discussion
6.1 Interpreting the null on score inflation
The absence of score inflation is the paper's most consequential result, and it is worth being precise about what it does and does not establish. Five independent tests - two Cochran–Armitage trend tests, a chi-square test of independence, a weighted binomial GLM with cluster fixed effects, and a test on top scorers as a share of all submissions - return p-values between 0.19 and 0.93. With 5,748 scored proposals the analysis is not underpowered for a distributional shift of practical size.
This rules out score inflation as the driver of the rising cutoff. It does not establish that AI is unused, nor that AI has no effect on individual proposals. What it establishes is that whatever applicants are doing differently, the aggregate distribution of evaluated quality has not moved, while the quantity of proposals has moved a great deal.
6.2 A reading consistent with all the evidence
Three findings must be reconciled: more proposals are submitted, a higher share clears the quality bar, and yet no more proposals reach the top of the scale while more are rejected as inadmissible. A single mechanism accounts for all three. If the cost of producing a submittable proposal has fallen - through AI assistance, institutional pressure to apply, or increasing reuse of previously drafted material - then the marginal applicant enters the pool. Marginal entrants are, by construction, not the applicants who score 14 and above. They enlarge the middle of the distribution and the bottom of it simultaneously, which is what the data show: the pass rate rises, the top band does not, and administrative rejections increase.
Under this reading, AI has lowered the cost of applying rather than raising the ceiling of quality. The competitive consequence is nonetheless real, because a fixed budget facing more qualified competitors must raise its effective cutoff. The practitioner intuition that winning has become harder is correct; the causal story commonly attached to it is not.
The evidence cannot separate AI assistance from other cost-reducing factors. The non-monotonic pass rate in particular suggests that call design and topic composition contribute, since a technology diffusion process would not reverse in 2026.
6.3 Why the published trend misleads
The measurement failure is instructive beyond this dataset. Two scoring scales share one database column, distinguishable only by a value range and the presence of an unrelated field. Averaging across them produces a statistic whose movement depends on the mixture of report types available at the moment of computation - which in turn depends on where calls sit in their deadline cycles. The resulting series is not merely noisy but systematically misleading in the most recent year, which is the year practitioners care about most. The general lesson is that aggregation over a heterogeneous population is safe only when population membership is verified, not assumed.
6.4 Practical implications
For applicants, the operative number is not the mean cutoff but the share of topics demanding near-perfect scores: half of resolved 2026 single-stage topics cut at 14.5 or above, and a quarter funded only proposals scoring 15.0. Planning against a historical expectation of 13.5 is planning against conditions that no longer obtain in much of the programme.
The two-stage track offers a structurally different proposition. Its final round is far less crowded - roughly 45% of above-threshold proposals are funded, against 12–18% in single-stage calls - at the cost of a stage-1 gate that admits about half of applicants. These calls are becoming scarcer, but where they exist they warrant different effort allocation. Given the small samples, this should be treated as directional guidance rather than a precise estimate.
6.5 Alternative explanations not excluded
Three alternatives remain consistent with the evidence. Evaluator behaviour could have changed - panels scoring more leniently at the margin would raise the pass rate without raising the top band, mimicking the observed pattern. Topic design could have shifted toward broader scopes attracting more applicants. And resubmission of previously unsuccessful proposals could account for volume growth without any change in the underlying applicant population. None can be tested with aggregate data lacking applicant identifiers or criterion-level scores.
7. Limitations
-
Observational design. No causal identification is attempted. The analysis establishes associations and eliminates one candidate mechanism; it does not estimate a treatment effect.
-
Three time points. With 2024, 2025 and 2026 only, "trend" means a monotone tendency across three observations. A single anomalous year materially affects the estimates, and no cyclical structure can be detected.
-
Incomplete final year. 63 of 314 single-stage 2026 topics have resolved, non-randomly by cluster and deadline timing. Only Clusters 5 and 6 are usable. Every headline result was re-estimated on that panel and holds, but the 2026 point estimates will move as further results are published.
-
Small two-stage samples. Fifteen stage-1 and 36 stage-2 records support the §5.6 findings; these are directional rather than precise, and no trend is testable within the stage-1 track.
-
Scraped source. The data are not an official statistical product. Known residual issues are documented in §5.1; unknown ones cannot be excluded. One programme part (Cluster 3, Civil Security) has no evaluation results ingested in any year across 85 topics, which is under separate investigation and means that part is absent from all results here.
-
No individual-level data. Without per-proposal scores or applicant identities, hypotheses about who is entering the applicant pool, and whether the same organisations are applying more often, cannot be tested.
8. Conclusions
Horizon Europe single-stage RIA and IA funding cutoffs rose from a mean of 13.52 in 2024 to 14.05 in 2026, and the share of topics requiring 14.5 or better rose from 32% to 51%. The published series showing no such increase - and showing a decline in 2026 - is a measurement artifact produced by averaging two incompatible scoring scales held in one database column.
The widely held explanation for the increase, that AI-assisted writing has raised the quality of the applicant field, is not supported. The distribution of evaluated scores is statistically unchanged across five independent tests, and the share of submissions rejected on admissibility grounds rose rather than fell.
The increase is instead attributable to competition intensity. Submissions per topic rose 41% while grants awarded per topic remained flat and delivery ran to plan, raising qualified proposals per grant by 50%. Controlling for that ratio removes the year effect on the cutoff entirely, attributing approximately 80% of the rise to competition. The funding rate among qualified proposals fell by a third.
Two-stage calls constitute a separate regime with a substantially less crowded final round, and are becoming less common. Taken together, the results are consistent with applying having become cheaper rather than proposals having become better - a distinction with direct consequences for how research organisations should allocate proposal-writing effort.
Appendix: supplementary tables
Table A1Cutoff trend by programme part, single-stage topics. Cell entries are mean cutoff with topic count. pBH is Benjamini–Hochberg adjusted within this family.
| Programme part | n | 2024 | 2025 | 2026 | τ | pBH |
|---|---|---|---|---|---|---|
| Cluster 5 · Climate, Energy & Mobility | 137 | 13.58 (69) | 13.56 (26) | 14.02 (42) | +0.128 | 0.256 |
| Cluster 4 · Digital, Industry & Space | 64 | 12.96 (26) | 14.02 (35) | 15.00 (3) | +0.427 | 0.0005 |
| Cluster 6 · Food, Bioeconomy & Environment | 60 | 13.52 (26) | 13.50 (20) | 14.11 (14) | +0.172 | 0.260 |
| Joint Undertakings | 31 | 14.31 (16) | 14.54 (12) | 13.17 (3) | −0.104 | 0.723 |
| Missions | 27 | 13.79 (14) | 13.35 (13) | - | −0.200 | 0.432 |
| Research Infrastructures | 15 | 12.75 (2) | 12.77 (13) | - | +0.020 | 0.931 |
| Cluster 2 · Culture & Inclusive Society | 13 | 12.91 (11) | 13.00 (2) | - | +0.025 | 0.931 |
Table A2Overall success rate by programme part, pooled within year.
| Programme part | n | 2024 | 2025 | 2026 | τ | pBH |
|---|---|---|---|---|---|---|
| Cluster 5 | 137 | 8.5% | 13.9% | 7.1% | −0.108 | 0.151 |
| Cluster 6 | 74 | 13.4% | 10.1% | 5.6% | −0.275 | 0.011 |
| Cluster 4 | 58 | 9.7% | 7.6% | 2.8% | −0.342 | 0.0098 |
| Joint Undertakings | 45 | 11.0% | 17.2% | 19.4% | +0.221 | 0.120 |
| Missions | 28 | 10.4% | 11.9% | - | +0.116 | 0.474 |
| Research Infrastructures | 17 | 8.1% | 39.8% | - | +0.525 | 0.030 |
| Cluster 2 | 13 | 10.4% | 5.8% | - | −0.243 | 0.377 |
Table A3Top-band (14–15) share by programme part. No cluster is significant after correction.
| Programme part | n | 2024 | 2025 | 2026 | τ | pBH |
|---|---|---|---|---|---|---|
| Cluster 5 | 134 | 0.210 | 0.165 | 0.236 | +0.038 | 0.857 |
| Cluster 4 | 64 | 0.113 | 0.168 | 0.196 | +0.236 | 0.162 |
| Cluster 6 | 59 | 0.173 | 0.150 | 0.168 | −0.034 | 0.857 |
| Joint Undertakings | 33 | 0.357 | 0.375 | 0.273 | +0.034 | 0.857 |
| Missions | 26 | 0.185 | 0.079 | - | −0.334 | 0.205 |
| Research Infrastructures | 19 | 0.265 | 0.217 | - | +0.037 | 0.857 |
| Cluster 2 | 13 | 0.127 | 0.031 | - | −0.276 | 0.632 |
Table A4Robustness of the volume result across sample definitions. Cell entries are mean submissions per topic.
| Sample | n | 2024 | 2025 | 2026 | τ | p |
|---|---|---|---|---|---|---|
| All single-stage topics | 771 | 21.0 | 32.4 | 32.9 | +0.094 | 0.0009 |
| Cluster 5 only | 161 | 24.9 | 13.1 | 31.5 | +0.134 | 0.031 |
| Cluster 6 only | 115 | 11.5 | 40.5 | 30.6 | +0.365 | <0.0001 |
| Like-for-like panel (5 + 6) | 276 | 20.2 | 30.3 | 31.2 | +0.214 | <0.0001 |
| RIA only | 499 | 21.5 | 35.9 | 37.2 | +0.125 | 0.0004 |
| IA only | 272 | 20.3 | 25.1 | 24.9 | +0.026 | 0.586 |
| Excluding Joint Undertakings | 613 | 22.7 | 38.7 | 41.5 | +0.191 | <0.0001 |
| Topics with published results only | 358 | 23.4 | 24.8 | 34.2 | +0.143 | 0.0006 |
| Excluding submissions ≤ 3 | 683 | 23.6 | 35.3 | 38.6 | +0.133 | <0.0001 |
| First-half deadlines only | 401 | 20.3 | 8.8 | 32.9 | +0.106 | 0.008 |
Reproducibility
The analysis comprises seven Python scripts run against a PostgreSQL snapshot: extraction (SQL), the 31-check audit, two targeted investigations of the blocking findings and the submissions variable, the main estimation covering RQ1–RQ5, the two-stage track, and the additional signals. Statistical work uses pandas, SciPy and statsmodels. Cleaning rules R1–R6 are implemented in a single shared module so that every result derives from an identical analysis population. Re-running against a later database snapshot requires no code changes.