
This is the long-form, evidence-backed version, written for the person who has to sign the invoice and defend the number afterwards. Every figure is sourced to a named study and current as of mid-2026. A companion interactive simulator lets you run your own case, gate by gate.
Europe's version of the problem is not the one in the headlines
Start with where Europe actually is, because it changes the question. In 2025, 20% of EU enterprises (10+ employees) used AI, up from 13.5% in 2024 (Eurostat). On generative AI specifically, European firms have essentially caught the United States: 37% adoption in the EU versus 36% in the US (EIB Investment Survey 2025). On any advanced digital technology it's 77% versus 78%. The adoption gap that everyone worries about has, quietly, closed.
The gap that hasn't closed is depth of use. 81% of US firms deploy AI across two or more business activities; in the EU it's 55%, a 26-point difference in how far the technology actually reaches into operations. Adoption inside Europe is also wildly uneven: large firms adopt at ~55%, small firms at ~17% (a 3.2× gap), and the country spread runs from Denmark at 42% to Romania at 5.2%, roughly eight to one. "The EU" is not one market for AI readiness.
Why this matters more in Europe than anywhere: the Draghi competitiveness report established that once you exclude the ICT sector, EU productivity ran roughly level with the US from 2000 to 2019. The entire transatlantic productivity gap is a technology-deployment gap (and real disposable income per head has grown about twice as fast in the US since 2000). For a European business, AI is not one initiative among many. It sits on the critical path of the single thing the continent is measurably behind on, and the ECB's own estimate is that AI could add up to 3.5 percentage points to euro-area productivity over a decade (≈2.9–3.1 percentage points after adjusting for readiness), "if firms use it."
So the European question is not "should we adopt AI?" You already have, or you will. It is: will any of it reach the P&L? On the current evidence the honest answer is usually not, unless you engineer it to. This piece is about the engineering.
The uncomfortable headline: adoption is high, realised value is rare
Three of the most rigorous recent data points, from three very different methods, say the same thing:
McKinsey (November 2025): 88% of organisations now use AI in at least one function, but only 39% can attribute any EBIT impact to it, and for most of those, below 5%. (In McKinsey's March 2025 survey the figure was starker still: over 80% reported no material enterprise-level earnings impact from generative AI.)
MIT (2025): 95% of organisations are getting zero measurable return; the value is concentrated in a ~5% that integrated AI into a real workflow.
The Federal Reserve Bank of St. Louis (2026): across 5,000+ firms' earnings calls, utilisation-adjusted total factor productivity grew 0.07% in the year to Q1 2026, and roughly 95% of the AI-productivity talk on those calls was about the future, not realised results.
That is the gap between "we use AI" and "it shows up in the numbers," and it is the whole subject. It is not a European failing (these are US and global figures), but Europe inherits it with an extra twist: the depth-of-deployment gap above, and, later, a regulatory cost line US firms don't carry.
Why the headlines seem to contradict each other (and don't)
Before the mechanism, one clarification will save you from being caught out in a board meeting. The AI-productivity literature looks contradictory (you can find "AI adds 40%" and "AI adds 0.07%" in the same week) because three different camps are measuring three different things:
Academic and central-bank studies measure the realised, causal effect, with a counterfactual. They find small, conditional, lagged effects, because they isolate what AI actually caused.
Consultancy and analyst surveys (McKinsey, PwC, BCG, Deloitte, IBM, Gartner) measure adoption, self-reported value, and expectations. They read more optimistically because they capture what firms do and hope, not what AI caused.
The task-level experiments measure a single task in controlled conditions: the numerator, not the outcome.
Keep them straight and the contradictions dissolve. To see the reconciliation clearly, take the apparent clash between "AI raises sector output 7–10%" (Johnston & Makridis, on US sector data) and "a precise firm-level zero" (a 2025 study of large US public firms). Both are true, because the output shows up outside the adopting incumbent's margin: as new firms entering, as lower prices for customers, and as capital's share of a bigger pie. The gain is real at the level of the economy and nearly invisible at the level of the ledger. That is not the literature confused; that is the thesis.
One more trap: three different "74%" figures circulate. PwC (2026): ~74% of AI's economic value accrues to ~20% of firms. BCG (2024): 74% of firms show no tangible value. Deloitte: 74% say their single best initiative meets ROI. They are not interchangeable, so cite the exact one.
The numerator is real, with a 2023 asterisk
Every AI business case opens with a task-level gain, and those gains are genuine and among the best-measured findings in the field. A BCG field experiment (GPT-4, mid-2023) had 758 consultants complete 12.2% more work, 25.1% faster, at roughly 40% higher quality on tasks suited to the tool. Randomised trials elsewhere: professional writing ~40% faster at higher quality (Noy & Zhang); customer-support agents resolving 15% more issues per hour, and 36% more for the least experienced (Brynjolfsson, Li & Raymond); developers 55.8% faster on a coding task (Peng et al.). A recurring detail we'll need later: the gains fall most heavily on junior and lower-skilled workers, since in the BCG study below-median performers improved 31% versus 11% for the top half.
Two honest caveats, because a European buyer will be sold the opposite:
First, the frontier is jagged. In the same 2023 experiment, on tasks outside the model's competence, AI users were 19 percentage points less likely to be correct, and more persuasive while wrong. But that specific caution is softening on 2026 frontier models and agents. The researchers who famously found AI slowing experienced developers down in early 2025 have since (Feb 2026) revised toward a modest speed-up, though in fairness their new estimate is statistically indistinguishable from zero. So don't over-index on "AI makes errors": that is the one part of this story that better models genuinely improve.
Second, and this is the point the "it's just old models" objection misses, only the numerator is model-sensitive. The seven reasons the gain doesn't reach the P&L are facts about your organisation and your market, not about the model. The freshest 2026 firm-level data (the 0.07% TFP; the 39% EBIT figure; a Danish study finding only 3–7% of AI time-savings passing through to wages) shows the conversion gap is still wide now, on today's models. Better models raise the numerator. They do nothing for the denominator.
"Isn't this just a story about old models?" Short answer: no. Task performance is rising and the error problem is receding; concede that. But adoption depth, complements, selection, lag, conversion and capture are structural, and every 2026 dataset that measures realised value (St. Louis Fed, McKinsey, the Danish register data) still finds the gap. Of the eight gates, exactly one moves with model quality.
The eight gates, with the evidence behind each
Treat these as the checklist for any AI spend. Each is a place the pitched saving leaks, each has a number, each has an action.
Gate 1: The task gain. What it is: the raw speed/quality uplift on the targeted task, 15–50%+. The catch: it's measured on a task chosen because AI is good at it, and it degrades on the long tail. Action: verify the gain on a task you've confirmed sits inside the model's competence; keep a human check where it doesn't.
Gate 2: Dilution. A task is a slice of a job, and the job is what you pay for. Because tasks are bundled, time saved on one flows to the others; the role doesn't shrink in proportion. The structural economics are unforgiving: a gain on a task worth ~10% of a role lifts that role's output by only ~4% (Freund & Mann). Action: size every use-case by the task's share of total working time, not by how visible the task is.
Gate 3: Adoption. Only genuine users produce anything, and, counter-intuitively, usage intensity barely predicts firm-level returns; buying more seats or pushing more usage adds little (Hajikhani & Schubert; Guerrini & Rice). What matters is embedded, extensive use. In Europe, remember the ceiling: under 25% of employees at large euro-area firms that "use AI" actually use it regularly (ECB). Action: budget for behaviour change and workflow redesign, not licence count.
Gate 4: Complementarity (the gate most firms fail). This is where the firm-level effect most often reads zero. Across very different datasets, the productivity gain from AI collapses to nothing without the surrounding assets: statistically indistinguishable from zero for firms without experienced AI talent (Fan, Chinese listed firms); zero for firms already saturated at the frontier in hyper-competitive markets (Chu, Xu & Han); and, in the finance data, the AI "premium" exists only for firms rich in intangible and data capital, a gap of roughly 24 points versus firms without (HBS). Where complements exist, they are priced: +2.4% per extra point of spend on software and data, +5.9% per point on training (EIB, 12,000+ EU firms), while the tool alone in small firms delivers ≈ nothing. Action: fund data, skills and process redesign alongside the tool, or model the return at zero and mean it.
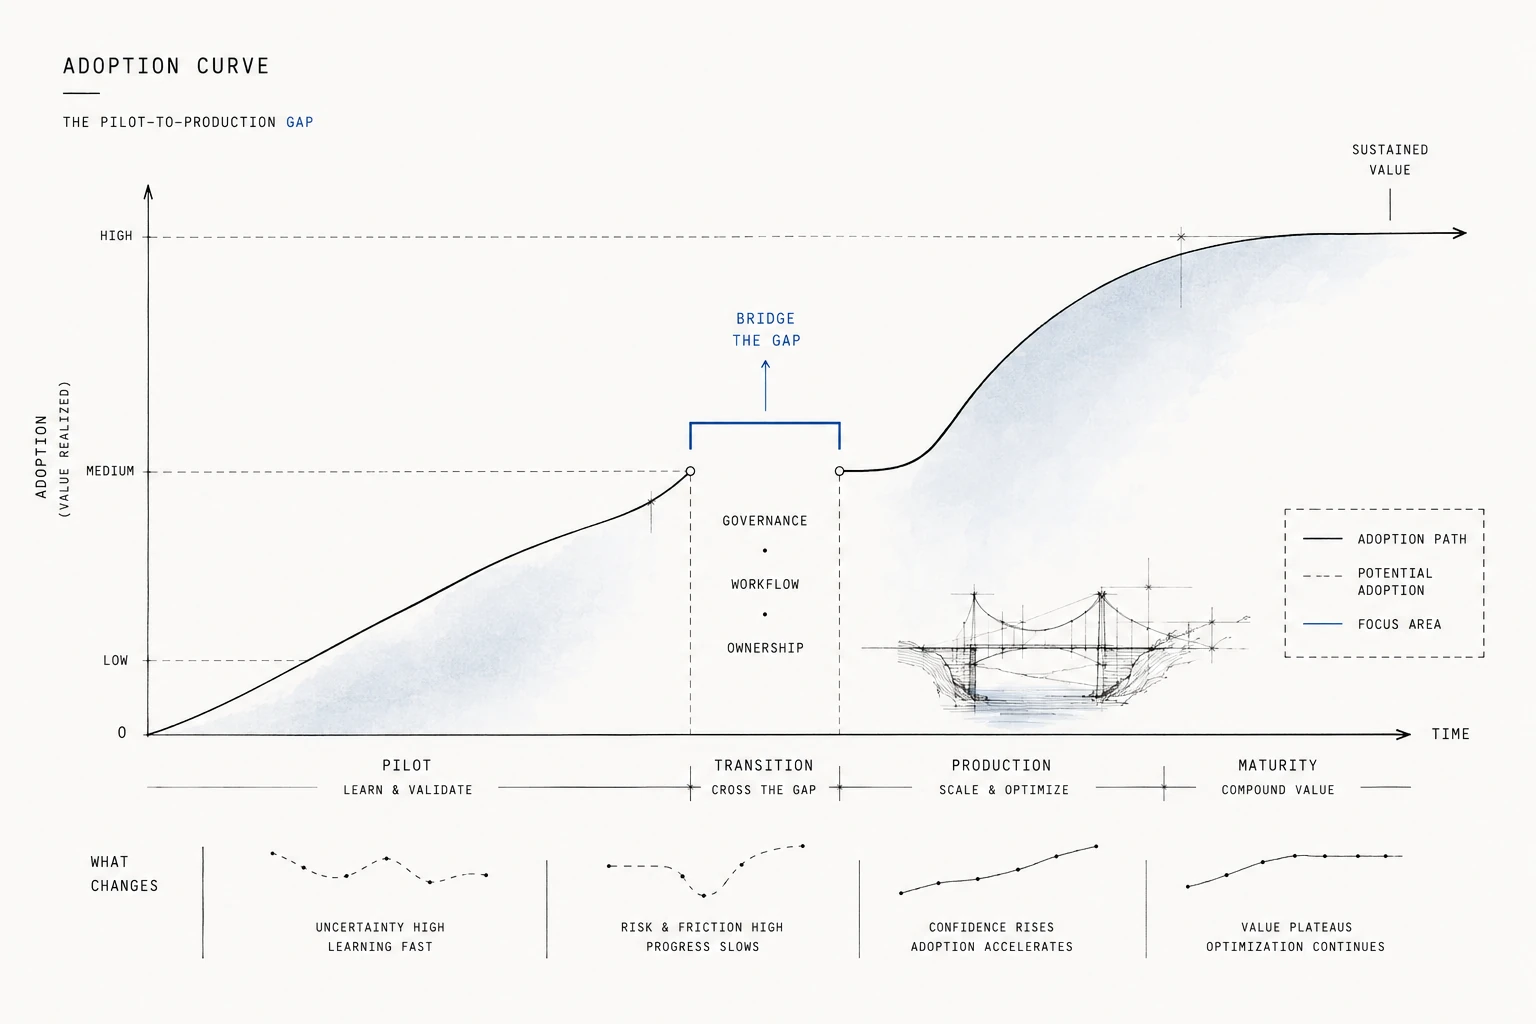
Gate 5: Pilot-to-production. Pilots run on clean data, motivated volunteers and unusual management attention; production has none of those. The cleanest illustration: the raw adopter productivity gap of ~16% collapses to a causal ~4% once you strip out the fact that better-run firms adopt first (EIB). Three-quarters of the headline was selection, not AI. Action: discount pilot results hard, and model production at a fraction of the demo.
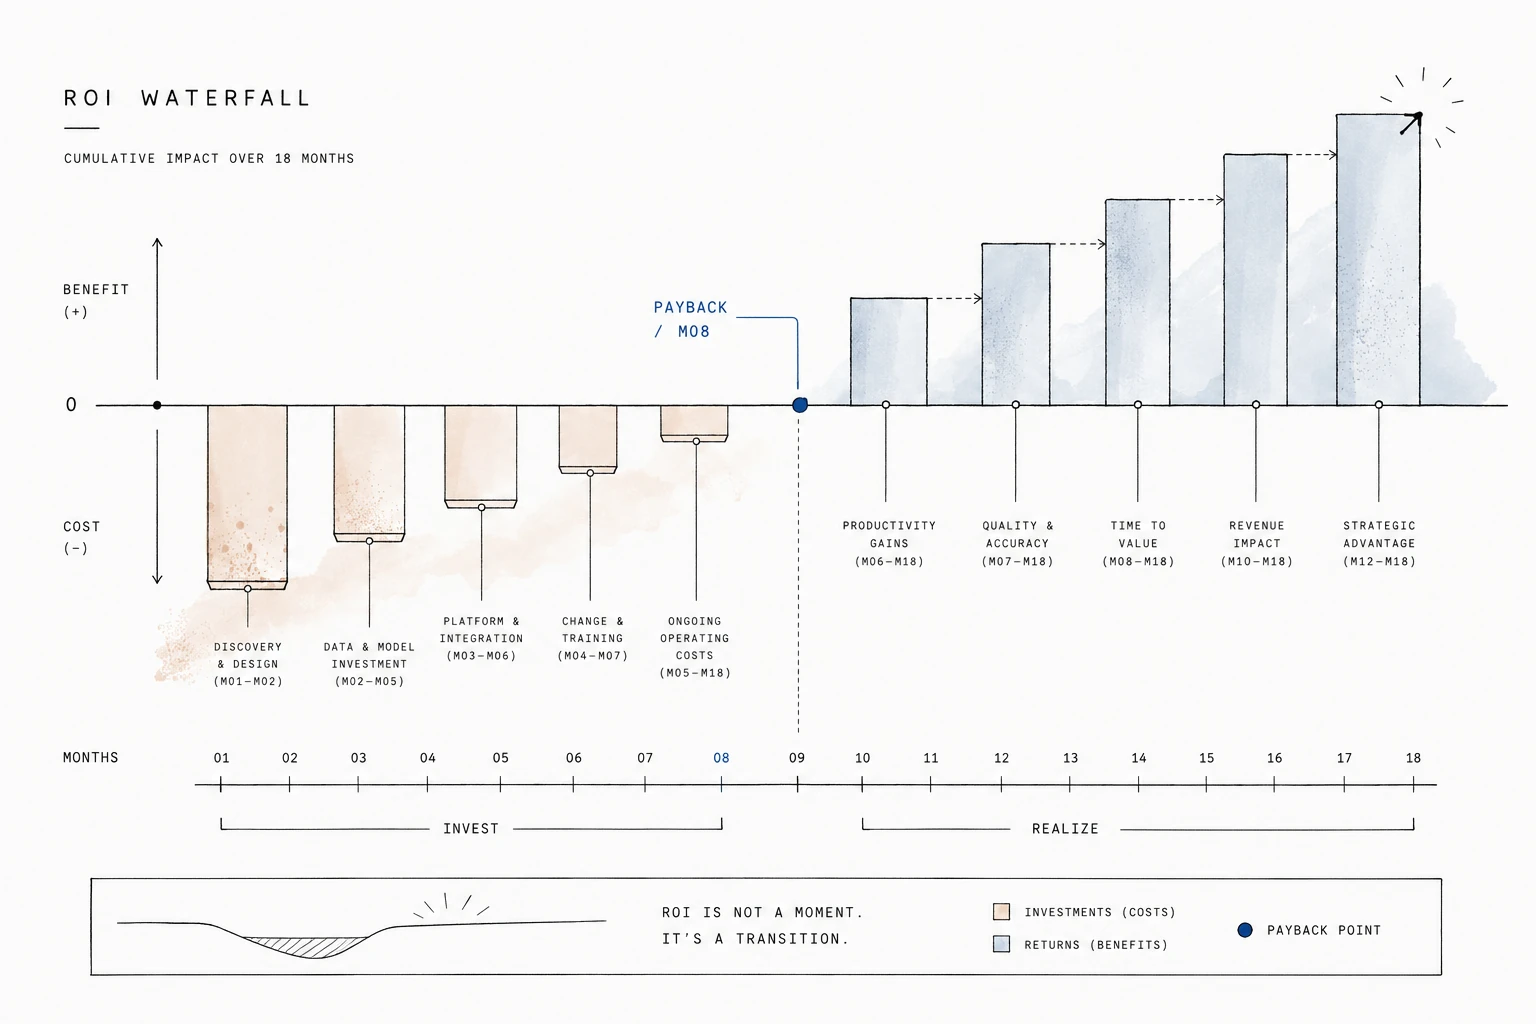
Gate 6: The lag. The payoff arrives on the technology's clock, not your deployment schedule. A Finnish firm panel finds gains only at a three-year lag (one- and two-year effects are indistinguishable from zero); a finance study finds operating profitability moving only in the second fiscal year; a study of sixteen years of earnings calls finds a decade of adoption that "looked like investment without return," recovering only for firms that had already reorganised. Firms adopting today without that groundwork show no measurable gain yet. Action: underwrite the valley, structure the case as a J-curve, and don't kill the programme in year one, because the evidence says it will still look like a loss then.
Gate 7: Conversion (where most of the money dies). Time saved is not money saved, and turning one into the other is a management decision, not a technical outcome. The base rate is stark: 83% of SME adopters report no change in staffing (OECD); a 2025 study of large US public firms finds a precise zero on employment, productivity, margin and ROA through 2025; the Danish data finds only 3–7% of time-savings reaching wages. When the gain does convert, it often runs through the least comfortable channel: a US time-use study finds AI exposure lengthening the working week by nearly four hours, which reaches ROA at about 26 basis points per added work-hour, with the gain arriving as a longer day rather than a smaller cost, while measured worker satisfaction falls. Action: decide in advance whether reclaimed capacity becomes cost-out, extra billable output, or acknowledged slack, and put a metric on it. The default is slack.
Gate 8: Capture. Even the realised gain may not stay with you. Of AI's output gains, only about 29% accrue to labour; the rest flows to capital (Johnston & Makridis). In competitive markets the surplus is competed away to customers: AI-exposed sectors show measurably slower price growth (≈ −4.2 points of cumulative excess inflation) and faster firm entry (≈ +6.2 points) (Carreño), with the advantage eroding to "table stakes" (Almirall's competitive normalisation). The important exception: an internal cost-out saving is yours to keep, because competition only erodes a gain you pass through as lower prices. Action: if you have no moat and the gain is a market-facing efficiency, assume it's competed away; if it's an internal cost reduction, you keep it.
What actually lands: think bimodal, not "a bit"
The mistake is to average. The evidence is bimodal: a leader cohort captures most of the value; everyone else captures almost none. PwC (2026): ~74% of AI's economic value goes to ~20% of firms. BCG: 74% of companies show no tangible value. The credible causal firm-level estimates, for the firms that clear the gates, cluster at ~1–4% of the affected cost base (EIB +4% causal; enterprise-TFP studies +1.1% to +3.5%). For the firm that doesn't clear them, it's ≈0.
So the number to put in the business case is not the vendor's 40%. It is one of two numbers: ~1–4% of the affected cost base if you are genuinely in the leader cohort (complements in place, at scale, converting deliberately, with a moat), or ≈0 if you are not, and you should be honest about which. A useful European reality check: IBM's 2025 EMEA survey found 66% of firms report operational productivity gains but only ~20% have hit their ROI targets. Two-thirds feel it; one-fifth can prove it.
A worked example: the same team, €1k or €15k
Because the abstraction hides the punchline, here is a concrete case: a 20-person back-office team, fully-loaded cost €36,000 each (a €720,000 base). A vendor pitches a 40% task gain with 55% adoption: €158,000 a year.
Run it the way most firms do (decent adoption, partial complements, and the freed time simply banked as slack), and the realised figure is about €1,000 a year: 0.14% of payroll, 99% of the pitch gone. Against a tool cost of even €10,000 a year, that is not a marginal case; it is a destroy-value, don't-buy-it case. The tool is right to say so.
Now change two things you control. Decide to actually convert the freed time to cost-out rather than slack, and the figure rises from ~€1,000 to ~€10,000. Then build the complements (data, skills, redesigned workflow), lifting readiness from 50% to 75%, and it reaches ~€15,000. With realistic small-firm economics (a ~€20,000–25,000 setup and ~€6,000 a year in tooling), that pays back in about two years.
Same twenty people, same tool, and a fifteen-fold swing driven entirely by two execution decisions. That is the thesis made personal: AI bought and banked is worthless; AI converted and complemented is a two-year payback. The distance between them is exactly the work that's invisible on the vendor's slide.
The European overlay: the AI Act belongs in the business case
One cost line US competitors do not carry. Under the EU AI Act, general-purpose-model obligations are already in force (since August 2025), transparency obligations apply from 2 August 2026, and high-risk (Annex III) obligations were deferred to 2 December 2027 under the 2026 "Digital Omnibus" (provisional, pending formal publication), which is real near-term relief but not a full reprieve. Credible cost estimates (CEPS): €193k–€330k to stand up a compliant high-risk system, plus ~€71k/year to maintain it; an SME deploying non-high-risk tools is more like €5k–€100k. Fines reach €35m or 7% of global turnover. None of this is a reason not to build, but it is a real figure that belongs in the denominator of any European AI case, and it means "is this system high-risk?" is now a financial question, not only a legal one.
The go/no-go scorecard
Run any AI investment through this before you commit. Score each gate 0–100% for your specific case; the product is the fraction of the pitched saving you can realistically book. If the biggest single leak is a gate you control (adoption, complements, conversion), that's your action list. If it's a gate you don't (capture, in a commoditised market), reconsider the spend.
| Gate | The question to answer honestly | Typical EU default | Evidence anchor |
|---|---|---|---|
| 1 · Task gain | Is the task genuinely inside the tool's competence? | 15–50% | Dell'Acqua; ICLE RCTs |
| 2 · Dilution | What share of the role's time is this one task? | ~25% | Freund & Mann |
| 3 · Adoption | Will people really use it, embedded in daily work? | ~45% of team | EIB; Eurostat; ECB |
| 4 · Complements | Do we have the data, skills and redesigned process? | 0% or 50%+ | Fan; HBS; Aldasoro |
| 5 · Pilot realism | Will it survive messy production? | ~60% | Aldasoro (16→4) |
| 6 · Maturity | Are we at year 1, or steady state? | ~30% in yr 1 | Hajikhani; HBS; Guerrini |
| 7 · Conversion | Will freed time become money, deliberately? | 17% slack / 75% cost-out | OECD; Humlum; Jiang |
| 8 · Capture | A moat, or will competition/customers take it? | ~50% (85% if internal cost-out) | Johnston; Carreño |
Multiply the affected cost base by the product of the eight scores, then subtract implementation, tooling and, in Europe, AI Act compliance. That number, not the demo, is your business case. The companion simulator does this live, with a leader-cohort benchmark and a waterfall of where each euro leaks.
The bottom line for a European decision-maker
The reframe that matters: AI ROI is a conversion problem, not a capability problem. Europe has closed the adoption gap and is closing the capability gap, because models improve weekly. What Europe has not closed is the deployment gap, and that gap is precisely the eight gates. The value the continent is missing is not in buying AI; it is in the unglamorous work after the model works: the data, the skills, the process redesign, the deliberate decision to turn saved hours into money, and a market position that lets you keep the gain.
That work is invisible on the vendor's slide and decisive on the P&L. Do it, and you are in the 20% capturing three-quarters of the value. Skip it, and you are in the 80% who adopted AI and, the 2026 data is now unambiguous, booked almost nothing. In a Europe whose entire productivity gap is a deployment gap, that is not a technology decision. It is a management one.
A note on the evidence
This piece rests on a graded review of ~40 recent firm-level and experimental studies, screened for relevance and source quality, cross-checked against the major 2025–2026 practitioner surveys (McKinsey, PwC, MIT, BCG, Deloitte, IBM, Gartner) and official EU statistics (Eurostat, EIB, ECB, the Draghi report), and verified as of mid-2026. Where the academic (causal) and practitioner (survey) evidence diverge, it is because they measure different things (realised value versus adoption and expectation), and both are cited for what they can support. Specific caveats worth carrying: the Eurostat 2023→2024 series has a questionnaire break; the AI-Act deferral is pending formal adoption; several firm-level studies are working papers or use proxies (job ads, keyword counts, task exposure) rather than audited P&L; and the consultancy ROI figures are self-reported and non-causal. The figures here are planning heuristics to pressure-test a decision, not forecasts, and not investment advice.
Sources and evidence anchors
- Eurostat - EU enterprise AI adoption (2024–2025), with a 2023→2024 questionnaire break.
- EIB Investment Survey 2025 - EU vs US generative-AI and advanced-digital adoption; depth of use; the ~16%→~4% adopter/causal correction; complement pricing across 12,000+ EU firms.
- Draghi report - The future of European competitiveness - the ex-ICT productivity gap.
- ECB - euro-area AI productivity potential (~3.5pp / decade) and regular-use ceiling at large firms.
- McKinsey - State of AI (November 2025; March 2025) - 88% adoption, 39% EBIT attribution.
- MIT (2025) - 95% of organisations getting zero measurable return.
- Federal Reserve Bank of St. Louis (2026) - utilization-adjusted TFP +0.07%; earnings-call analysis.
- Johnston & Makridis - sector-level output gains; labour vs capital share of AI gains.
- Dell'Acqua et al. (BCG / Harvard, 2023) - the 758-consultant field experiment; the jagged frontier.
- Noy & Zhang - professional-writing RCT.
- Brynjolfsson, Li & Raymond - customer-support field study.
- Peng et al. - developer coding-speed RCT.
- Freund & Mann - task-to-role dilution economics.
- Hajikhani & Schubert; Guerrini & Rice - usage intensity vs firm-level returns; the lag.
- Fan - Chinese listed firms; complementarity and AI talent.
- Chu, Xu & Han - frontier saturation in hyper-competitive markets.
- HBS (finance data) - intangible/data-capital "premium"; second-fiscal-year profitability.
- Aldasoro et al. - pilot-to-production selection (16→4).
- OECD - 83% of SME adopters report no change in staffing.
- Humlum (Danish register data) - 3–7% of time-savings reaching wages.
- Jiang - AI exposure and working-hours / ROA.
- Carreño - AI-exposed sector price growth and firm entry.
- Almirall - competitive normalization ("table stakes").
- PwC (2026); BCG (2024); Deloitte - the three distinct "74%" claims.
- IBM (2025, EMEA) - 66% report gains, ~20% hit ROI targets.
- CEPS - EU AI Act compliance-cost estimates.
- Interactive model - the P&L simulator.